


[6/10] How to increase value per user
[6/10] How to increase value per user
Commonly overlooked levers for increasing Activation & Retention rates

In the previous two essays, we focussed on the levers for ‘User Growth’. And, in this one, we will focus on ways to drive ‘Value Growth’. While User Growth was all about increasing the total numbers of users for your product/service, Value Growth is about increasing the net value per user.
To understand the levers to increase net value per user, we have to, as always, first break it down into its independent parts. Or, in simple terms, we need to first write down the formula for it. You would recall the formula from the first essay as:
Net value per user = LTV (lifetime value) minus CAC (customer acquisition cost)
Now, we need to break them down to the level-2 metrics. LTV has two parts: the margin you make per average order multiplied by the number of times an average customer buys from you (in the lifetime window defined by you which can be 6 months, or 1 years, or 5 years, etc.). CAC too has two parts: how much it costs you to bring a prospective customer to your platform and what percentage of them actually try out your product/service. Putting them together:
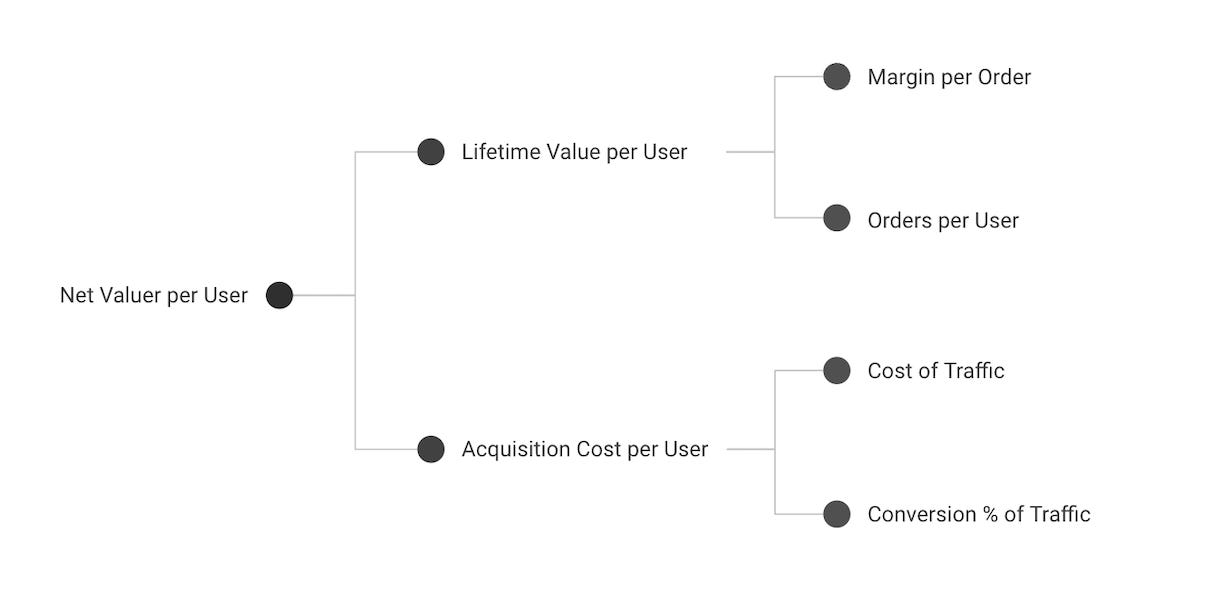
What we can infer from the previous paragraph, and the diagram above, is 4 ways to increase net value per user:
Increase profit margin per order
Increase orders per average customer (Retention Rate)
Decrease cost per click (by decreasing cost per impression or, more likely, by increasing click through rates - a topic covered in the previous essay)
Increase % of clicks that convert (Activation Rate)
However, just knowing the level-2 or level-3 independent metrics is not enough; we still need to figure out the levers to improve these independent metrics. And, that comes from our understanding of the core business drivers. So, what are the core business drivers for Activation & Retention rates?
I very frequently get the question: ‘What’s going to change in the next 10 years?’ And that is a very interesting question; it’s a very common one. I almost never get the question: ‘What’s not going to change in the next 10 years?’ And I submit to you that that second question is actually the more important of the two — because you can build a business strategy around the things that are stable in time. … [I]n our retail business, we know that customers want low prices, and I know that’s going to be true 10 years from now. They want fast delivery; they want vast selection. It’s impossible to imagine a future 10 years from now where a customer comes up and says, ‘Jeff I love Amazon; I just wish the prices were a little higher,’ [or] ‘I love Amazon; I just wish you’d deliver a little more slowly.’ Impossible.
In the above quote, Jeff Bezos lays down a MECE framework for the core drivers of any retail business, including online marketplaces and brands. The core drivers invariably are: 1. Price, 2. Quality, 3. Selection, and 4. Experience (including delivery and customer service experience).
Now, business strategy is all about trade-offs. Which means a marketplace or brand would not seek to maximize all of the drivers. On some axes, brands will meet the table stakes, that is, offer the minimum that’s expected of them (for example, offer cash on delivery service and no questions asked returns, in case of Indian e-commerce). And, they will seek to be better than the rest on a different retail driver axis (for example, highest quality or unique selection). Marketplaces will often seek to be best-in-class on price and experience, whereas meet table stakes on quality, and in selection go for width rather than depth.
The above two paragraphs might seem a sudden detour but I posit that understanding the core business drivers for retail, and then understanding which parameter your business is trying to be best on and which ones just meet table-stakes on, is core to devising your retention and activation strategy too. Growth teams often jump to the potential levers in marketing communication or the platform interface to increase value per user. But a more holistic approach would be to first understand the mapping between different components of the value per user map to the corresponding retail drivers.
Therefore, in this essay, our framework would be to look at the problem of improving activation and retention rates, from 3 different lenses:
Demand
Supply
Demand-supply matching mechanism
Off-platform: Marketing communication
On-platform: Product management
Retention Rate: Demand levers
This is the most overlooked, but the easiest, way to fix the customer retention rate for a business: acquire customers that are more likely to be retained. Duh, you might say. But, you’d be surprised by how often startups jump to marketing-led or product-led solutions, before considering this. And, wait, do you know if your startup is ignoring this lever too? Answer these 3 questions:
What is your ideal customer profile?
What is the net value per user for your ideal customer profile? And, what is the same number for other profiles?
What % of customers acquired in the last month belonged to the ideal customer profile and what % from other profiles?
If you can’t answer the second and third one readily, or if there is no instrumentation in your business to regularly track the answer to those questions, your business is not only missing out on the biggest retention lever, but also might be working against the product-market fit. Let me explain with an example. During Meesho’s social commerce phase, we had quantified the retention rates for different customer profiles and it was very clear to us that apart from a couple of customer profiles, others had very low retention rates and thus had very low net value per user. But we could see competitors going after exactly those profiles that we were happy to not acquire. Why were they acting differently? Often this happens because of lack of measurement of customer profiles and their respective retention rates.
So, how do you set it up? For the traffic landing on your web/mobile app, you can ask the visitors which persona do they belong to. And, once the transaction is completed, ask the customers which persona do they belong to. Not all of them will reply and response rates might differ among different profiles introducing some bias – but that’s alright; it is better to have slightly biased data than to be completely in the dark.
Now you can map the visitor & customer data to the channels/campaigns they are coming from, and map the customer data with their subsequent orders. This will give you activation and retention rates by customer profiles. That is, which visitor profiles convert to being a customer and, if they do, how frequently they come back. The retention rates will also give you a clear picture of which profiles are profitable for you and which ones are not. And, the contribution of these profiles by different channels/campaigns will give you an idea as to which ones are bringing you the profitable profiles and which ones are not. You can then tweak the targeting or messaging in the channels/campaigns bringing you unprofitable customer profiles to see if that changes anything, but, more importantly, you can start allocating more expenditure to the channels/campaigns bringing you a higher % of your ideal customer persona, by moving it away from the ones that don’t.
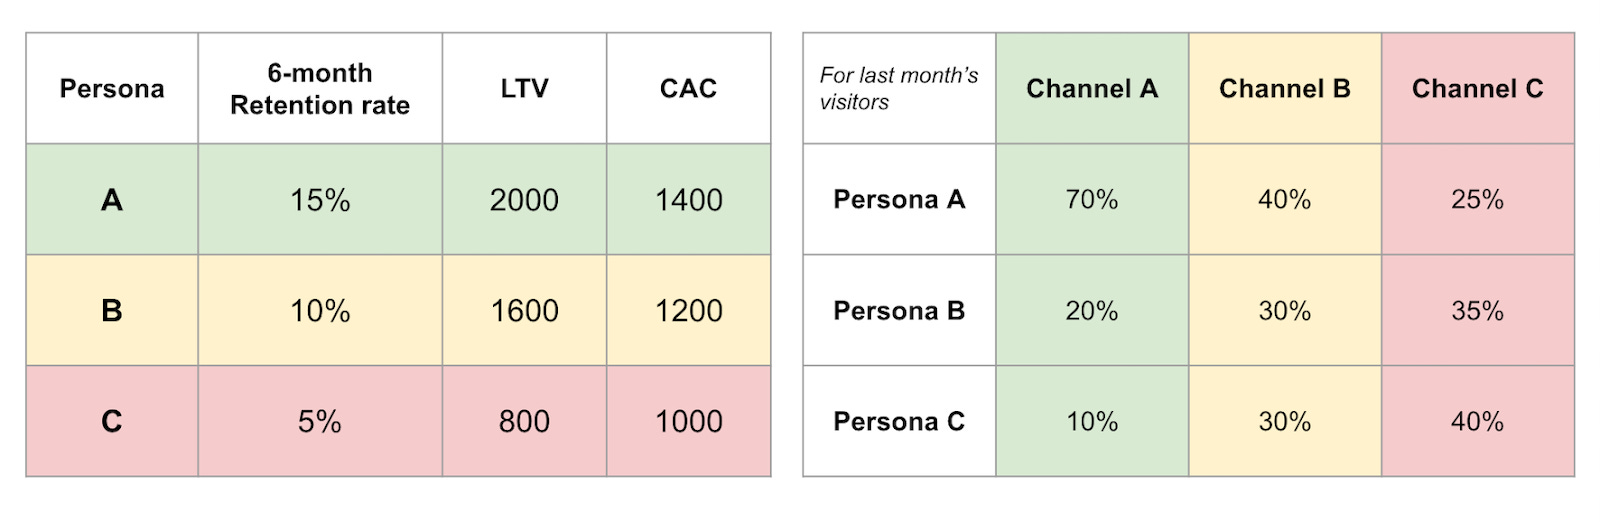
For example, from the above tables it is clear that Persona 1 is the one that brings higher LTV despite having a higher CAC and has a stronger product-market fit for. So, we should be scaling the channels and campaigns that bring more of Persona A and de-scaling the ones that don’t.
And, that is what I mean by solving retention rate first with the simplest of things – acquire users that are more likely to be retained – before jumping into more complex levers. Once you build such an instrumentation for your startup, it will be a simple but powerful competitive advantage. As covered in the previous essay, the product-market fit or product-market-channel fit is not a one-time certification that startups can achieve and then start scaling. It is a spectrum where your product-market-channel fit can get weaker and weaker, if you are scaling without instrumenting some way to sample some of the visitors and customers, to measure their persona, and to quantify their respective retention rates and contribution by channels and campaigns.
So, take a look once again at the 3 questions asked at the start of this section and if you can’t answer them for your startup, you will have to fix it before you realize one day that your latest cohorts are not delivering the same retention rates as the previous cohorts, and the growth rate is slowing down.
Retention Rate: Supply levers
Customer retention curve often falls early and then stabilizes after a point. For content apps, the retention rate stabilization might happen after 4 weeks or so. For ecommerce platforms and brands, this typically happens after 6 months. If you zoom into the retention rate curve further, you will see that most of the customer drop-off for transactional platforms happens after their first order or first month, and for non-transactional platforms (content, utility, gaming, etc.) it happens right after the first day of using it. This is something we can relate to intuitively from our own behavior as consumers: we uninstall most apps right after we try them out. And, often, we either use a brand/marketplace (food, grocery, shopping, etc.) quite regularly, or not at all, depending on how the first transaction went.
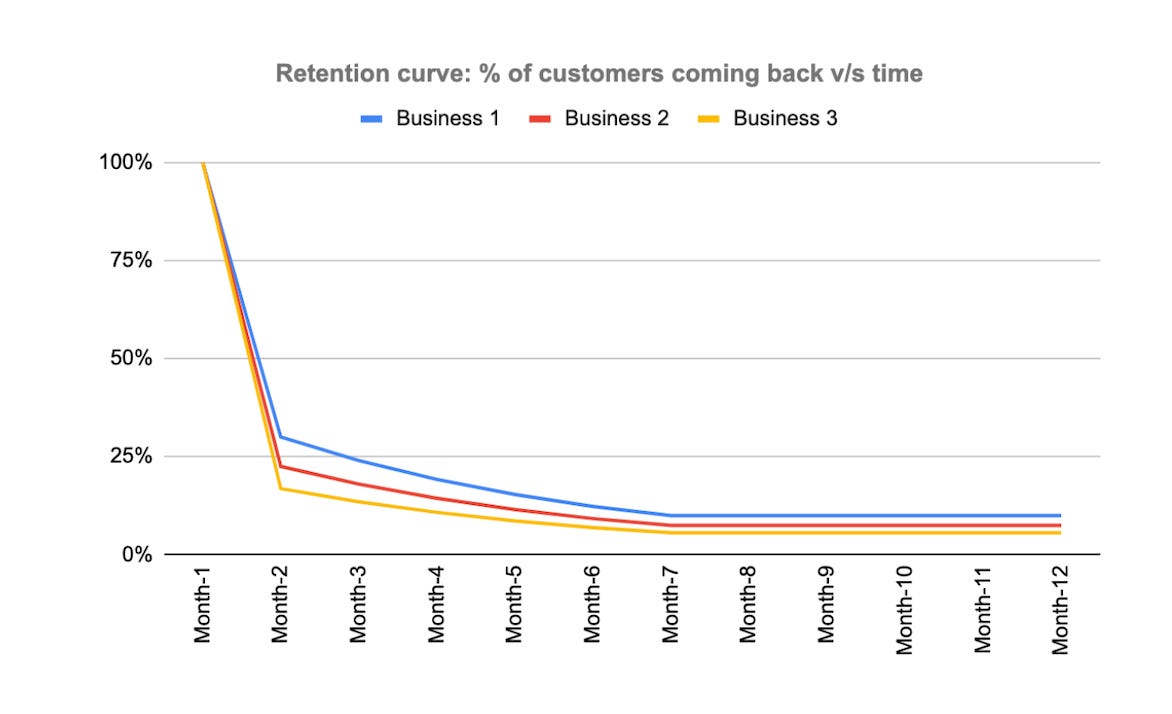
So, you have two problems at hand: how to fix the drop-off that happens very early on in the customer’s journey and the drop-off that keeps happening later on. While the problems might seem similar, the solutions for the two problems, from a supply point of view, are different.
If most of the drop-off for an ecommerce brand happens from first to second order, the structural way to reduce this drop would be to improve the experience of the first order. Going back to Bezos’s framework for retail drivers, the applicable ones in the context of first order to second order are: quality and experience.
You see, price and selection are the parameters that the customer is already aware of and had taken into consideration while making the first purchase. The ones that the consumer will experience only after the product is delivered are: quality and experience (especially the delivery experience). While the buyer would have built a perception of the level of quality and experience too – from the various information sources such as reviews, expected delivery times, return policy, etc. – the perception would get reset as soon as the buyer experiences it tangibly, and first-hand, after the product gets delivered for the first time. Based on the time it took to deliver, the experience when the customer opened the first package, and, above all, the quality of the first product, for their specific order. If you personally had a good experience, as a consumer, no number of bad reviews can convince you otherwise. And, same for a bad experience.
Tony Hsieh, the founder of Zappos, in his book ‘Delivering Happiness’ went so far as to say the cost of experience should be considered and included as customer acquisition costs. And, while that probably breaks the concept of ‘acquisition’ cost, you get the point.
So, yes, quality and experience are drivers for first to second order retention; but what can a growth team do about it? In established marketplaces and brands, the growth team can focus on: how much uplift in lifetime value can come from additional quality and/or experience improvement in the first order? If there is a threshold of quality and delivery time, beyond which the gain in retention rate and lifetime value is only marginal, that threshold can be used for selecting products to be shown to the first-time users.
Moving from early retention to the rest of the customer lifecycle, if we think back to Bezos's framework for retail business drivers, selection clearly becomes the biggest driver for long term retention and the frequency with which the customer comes back. And the growth team’s job can be to identify those opportunity areas in the supply, within the constraints of the category. This might mean making sure adjacent supplies that the consumer needs for their use case are available on the platform. For grocery delivery business, it might mean prevention of a customer churning because that one ingredient is not available on the app. For e-pharmacy businesses, it might mean preventing users from switching to another business just because that one medicine on their prescription is not available on the platform. And so on.
One final note on this: there is, of course, a baseline retention and frequency inherent in the category. Even the best of tax filing software will have its customers returning to it only once a year while the most mediocre of grocery delivery apps will have a customer base using it every week, albeit begrudgingly. Hence, benchmarking the early and late retention rates and frequencies, that are relevant to your specific business category, is extremely important to understand the upside for your efforts in ensuring supply selection completeness. This is an idea – benchmarks and upsides – that is crucial to the job of a growth lead and we will revisit it in the next essay.
Retention: improving demand-supply match with off-platform communication
We have focussed so far on demand and supply levers to improve the retention rates, and have not touched on the common growth solutions that are offered (discount on second order, loyalty program benefits, lifecycle communication flow, etc.). There are two reasons for this. First, the baseline retention rate is decided by the core retail drivers and how effective the acquisition campaigns are in getting the right customer profile. Any communication or incentive solution can only build on that baseline. The second reason is that the design of such solutions itself builds on the core drivers. Let me explain this point.
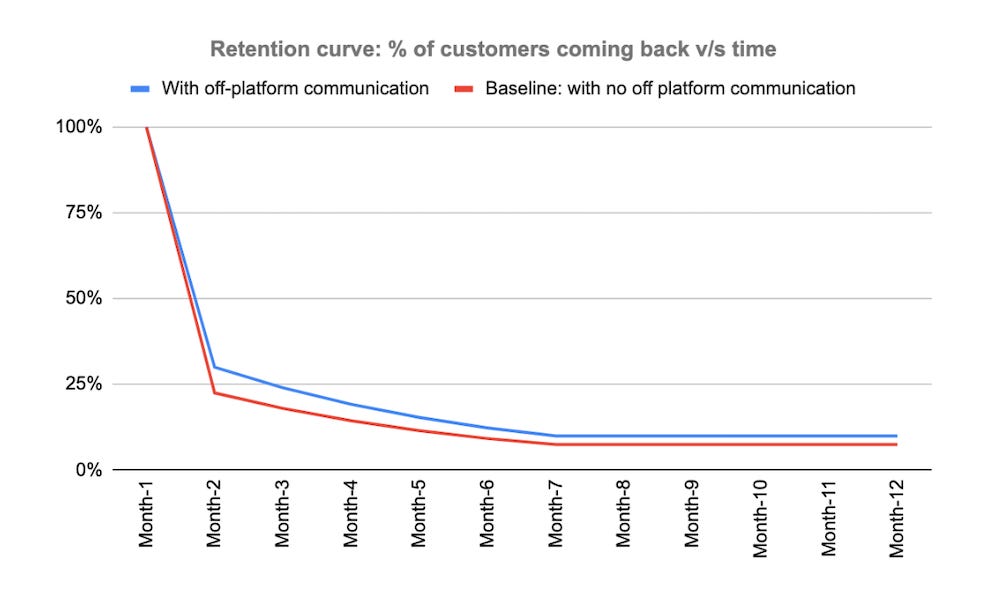
Retention is often an off-platform activity. User discovers your business on a content or search platform, comes over to your platform, completes the transaction, and … moves on with their life. Now while the quality and experience will dictate where the user comes back or not in the short term, and the selection in the long run, it is still important to nudge the user to ensure that the user not coming back is not due to a lack of information. And, since we are solving to reduce a potential information gap, the key job while designing a communication campaign to nudge the user is to deliver the right information to the right user at the right time.
During early stages of a user’s interaction with a platform, this requires designing an customer onboarding program. Whereas in later stages of a user’s interaction with a platform, it requires a more personalized communication program, and recency-frequency-monetary (RFM) segmentation is a common framework to build it.
Suppose a customer has purchased for the first time from your platform. Depending on the specific product that they bought, what are they likely to buy next and after what time? Answers to these questions for an existing platform can come from purchase behavior of other customers. And the answers then gives you the ‘the right information to the right user at the right time’ framework for designing the customer onboarding program.
If the customer has been on the platform for some time, we know the frequency with which they buy, which products (or category of products) they have affinity to, and depending on how recently they had bought, a more personalized prediction can be made (either for just that person or for similar group of customers sharing those parameters i.e. the segment) about what are they likely to buy next and when.
While the above two are the frameworks to design the communication, often incentives are added to sweeten the deal. This can be in the form of loyalty benefits that are specific to the customer, or in the form of product-specific sales and discounts.
Activation: core demand and supply levers
While Retention rate is the % of customers that will come back to you, Activation rate is the % of visitors who will convert. So, when it comes to the core demand and supply levers, there are a lot of similarities but some differences too.
It’s straightforward when it comes to demand levers. In the case of Activation rate, just like Retention rate, the best way to improve it is through segment thinking: cut back on channels and campaigns that are not bringing you the right customer profile and double down on the ones that are.
For supply levers, while quality and experience were drivers for early retention and selection was the driver for long-term retention, when it comes to activation rate, the core drivers are price and selection differentiation, while expectation setting of quality and delivery and customer service experience are table-stakes. Now, this is a broad sweeping statement, and will thus have many exceptions, but let’s think about this from a consumer’s point of view.
You have just discovered a new brand. What will get you to try it for the first time? Assurance about the overall experience is good but that’s probably not what caught your eye about the brand. It probably was something unique about their selection that’s absent in other brands or marketplaces. Or it’s the same selection but at a lower price, in case of a new marketplace. Or perhaps the superiority of quality itself is the differentiator in case of a brand, or the superiority of service itself is the differentiator in case of a marketplace.
To reiterate the point, the similarity between the supply drivers for Retention and Activation rates is that it is selection that drives both of them. But in case of Activation rate, it is often the uniqueness of the selection that is the core driver, while in case of Retention it is generally the width of the selection.
Activation: improving demand-supply match with on-platform communication
While retention happens off-platform, activation takes place on platform by definition. And the job of the platform, therefore, is to make the best possible demand-supply match, in as few steps or as less time as possible, while reducing the information overload.
How do we reduce the information overload? In three steps:
Defining the steps to convert, and the respective primary job-to-be-done for each step
Keeping only relevant information for that primary job on that step
Clear action/path to the next step
For example, the job of an advertisement is to quickly highlight the differentiating feature of the product that the ideal customer would be interested in. Once the user clicks on the ad and reaches the landing page, the job-to-be-done by that page is to expand on that differential feature, in a congruent fashion by building on the ad. If the prospective customer is landing on the homepage or home screen, the job-to-be-done is to showcase the key differentiator, in case of a brand, or the selection at a glance, in case of a marketplace. Once the user chooses one category from the selection and goes to a category page, the job-to-be-done is to showcase different products within the category and information about the differences between them. Once the user chooses a product, the job-to-be-done by the product page is to highlight the differentiating features of the products, while establishing the table stakes of quality and experience, and giving a clear path to the next step i.e. to buy it.
The big job of the interface across all the steps is to reduce information overload and decision fatigue. Therefore, a layout which closely matches the common platforms they already shop on, is often the best way to go. The differentiation of the product should be highlighted by the copy and the creatives, rather than changes in the information architecture itself. Essentially: keep the bones, change the muscle.
Before going for conversion rate split tests on other stuff (such as: does including icons for service highlights increase conversion rate? Should the discount be in absolute amount or percentage?), the growth team should first seek to cover the basics:
Is the sequence of steps, and the user interface of steps, consistent with other similar platforms in the category that the ideal customer profile buys from?
Is every step in the funnel doing its primary job-to-be-done, keeping only relevant information for that step, highlighting the key differentiating feature and the next step?
Once these basics have been completed, a baseline of activation rate would be established, and then incremental improvement can be brought with clever conversion rate optimisation techniques. However, often these techniques also build on the same mental models:
making the differentiating feature clearer e.g. BlissClub’s product feature callouts in gallery images
making the action to be taken or next step clearer e.g. color and size of add to cart button, copy of the call-to-action button.
reducing information overload by giving ability to scan the relevant information visually and quickly e.g. icons for service highlights, payment trust markers.
reducing information overload and decision fatigue by removing information that’s not relevant to the decision to be taken at that step
In fact, you can come up with your own ideas through this framework, and you should pass the techniques given by someone else through it.
One final note on activation: the big assumption inherent in the section so far is that it’s an existing category and the rules for the user interface have been established. However, when it comes to products that are creating a new category of their own, and where clear equivalent products don’t exist, the job of teaching the user how to use the product falls on the product itself. In such cases, onboarding becomes extremely critical and also significantly more difficult.
The common framework for solving such a problem is to identify the aha moment from data – the point where the users realize the utility of the product as evidenced by a tipping point in the long term retention – and then design the activation flow in the product to get user to that point as fast as possible. The most famous example of this is, of course, Facebook app’s flow designed to get the user to 7 friends in 10 days.
Summary
In this essay, we covered the following questions:
How to improve Retention rate? More importantly, how to think about it holistically from a supply and demand perspective, rather than just through the lens of off-platform communication and incentives.
How to improve Activation rate? How is it different from Retention rate drivers? How to think structurally about the conversion steps?
In the next essay, we will combine the ideas from the three essays, from the second section of the series so far on executing growth ideas, and seek to answer how to decide between focussing on different problems (acquisition versus activation versus retention), or different solutions (acquisition from channel A or channel B, or activation improvement through project X or project Y).
If you have any suggestions on this article, or need any clarifications, I am reachable at sudhanshu@skilletal.com